Opérations
Overview
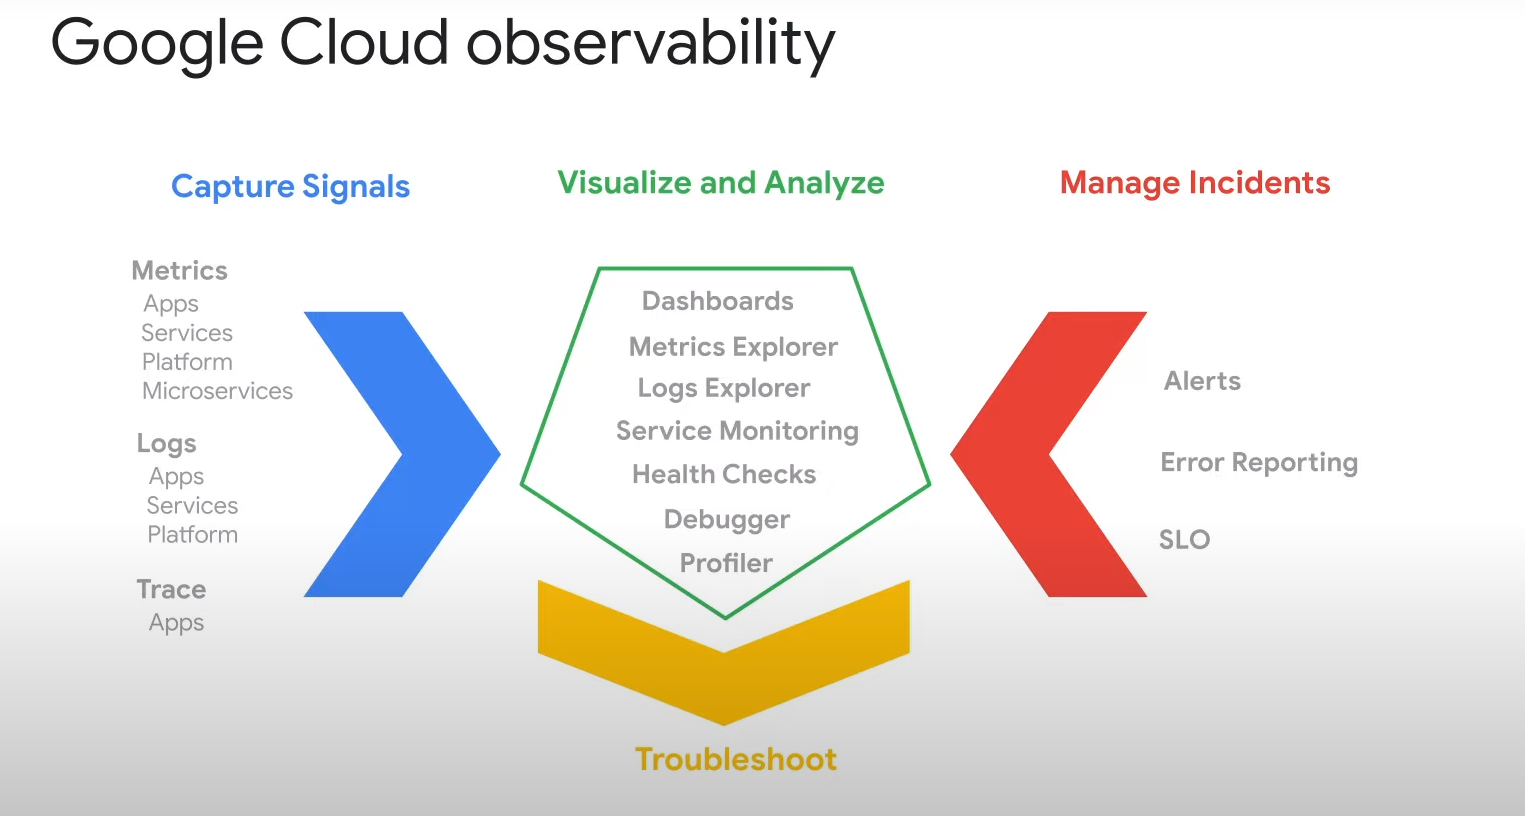
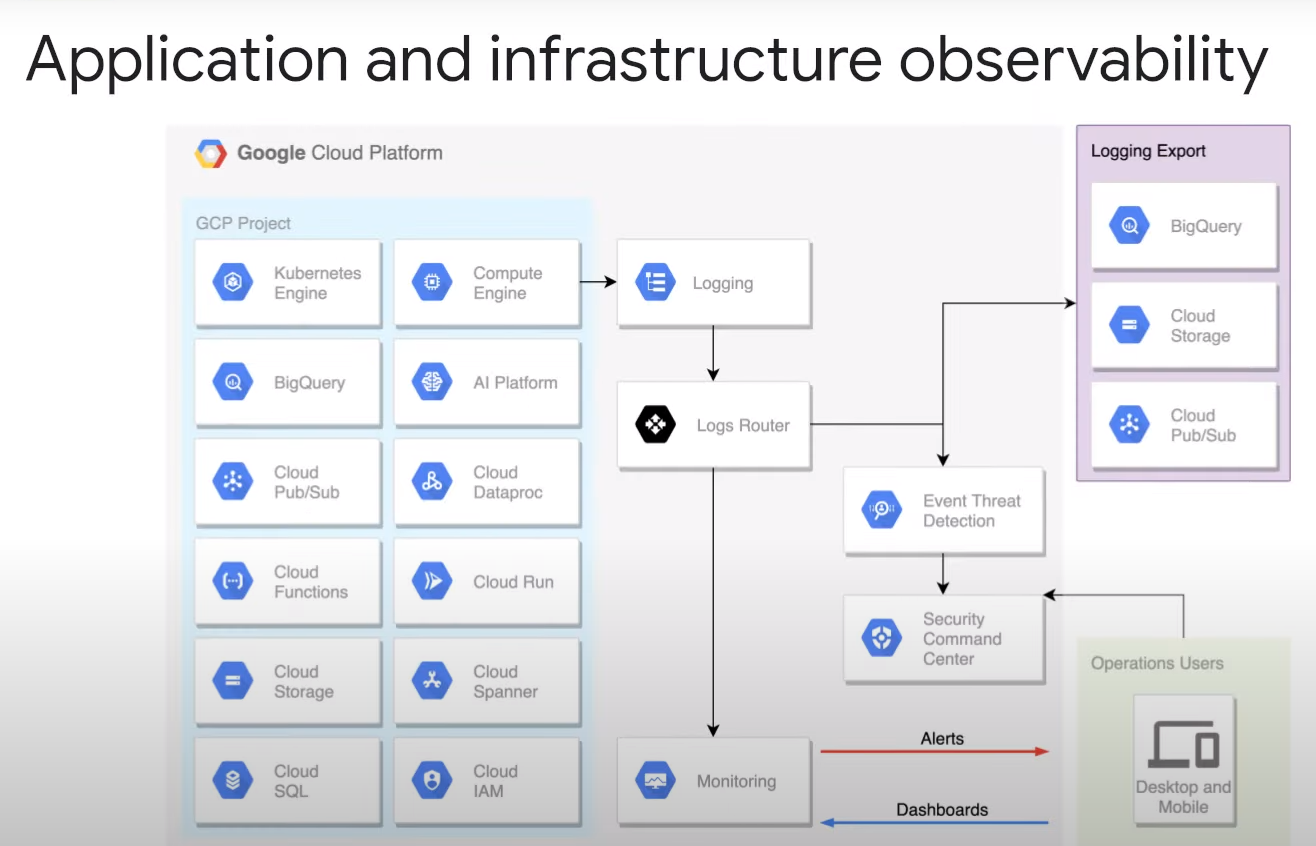
Monitoring
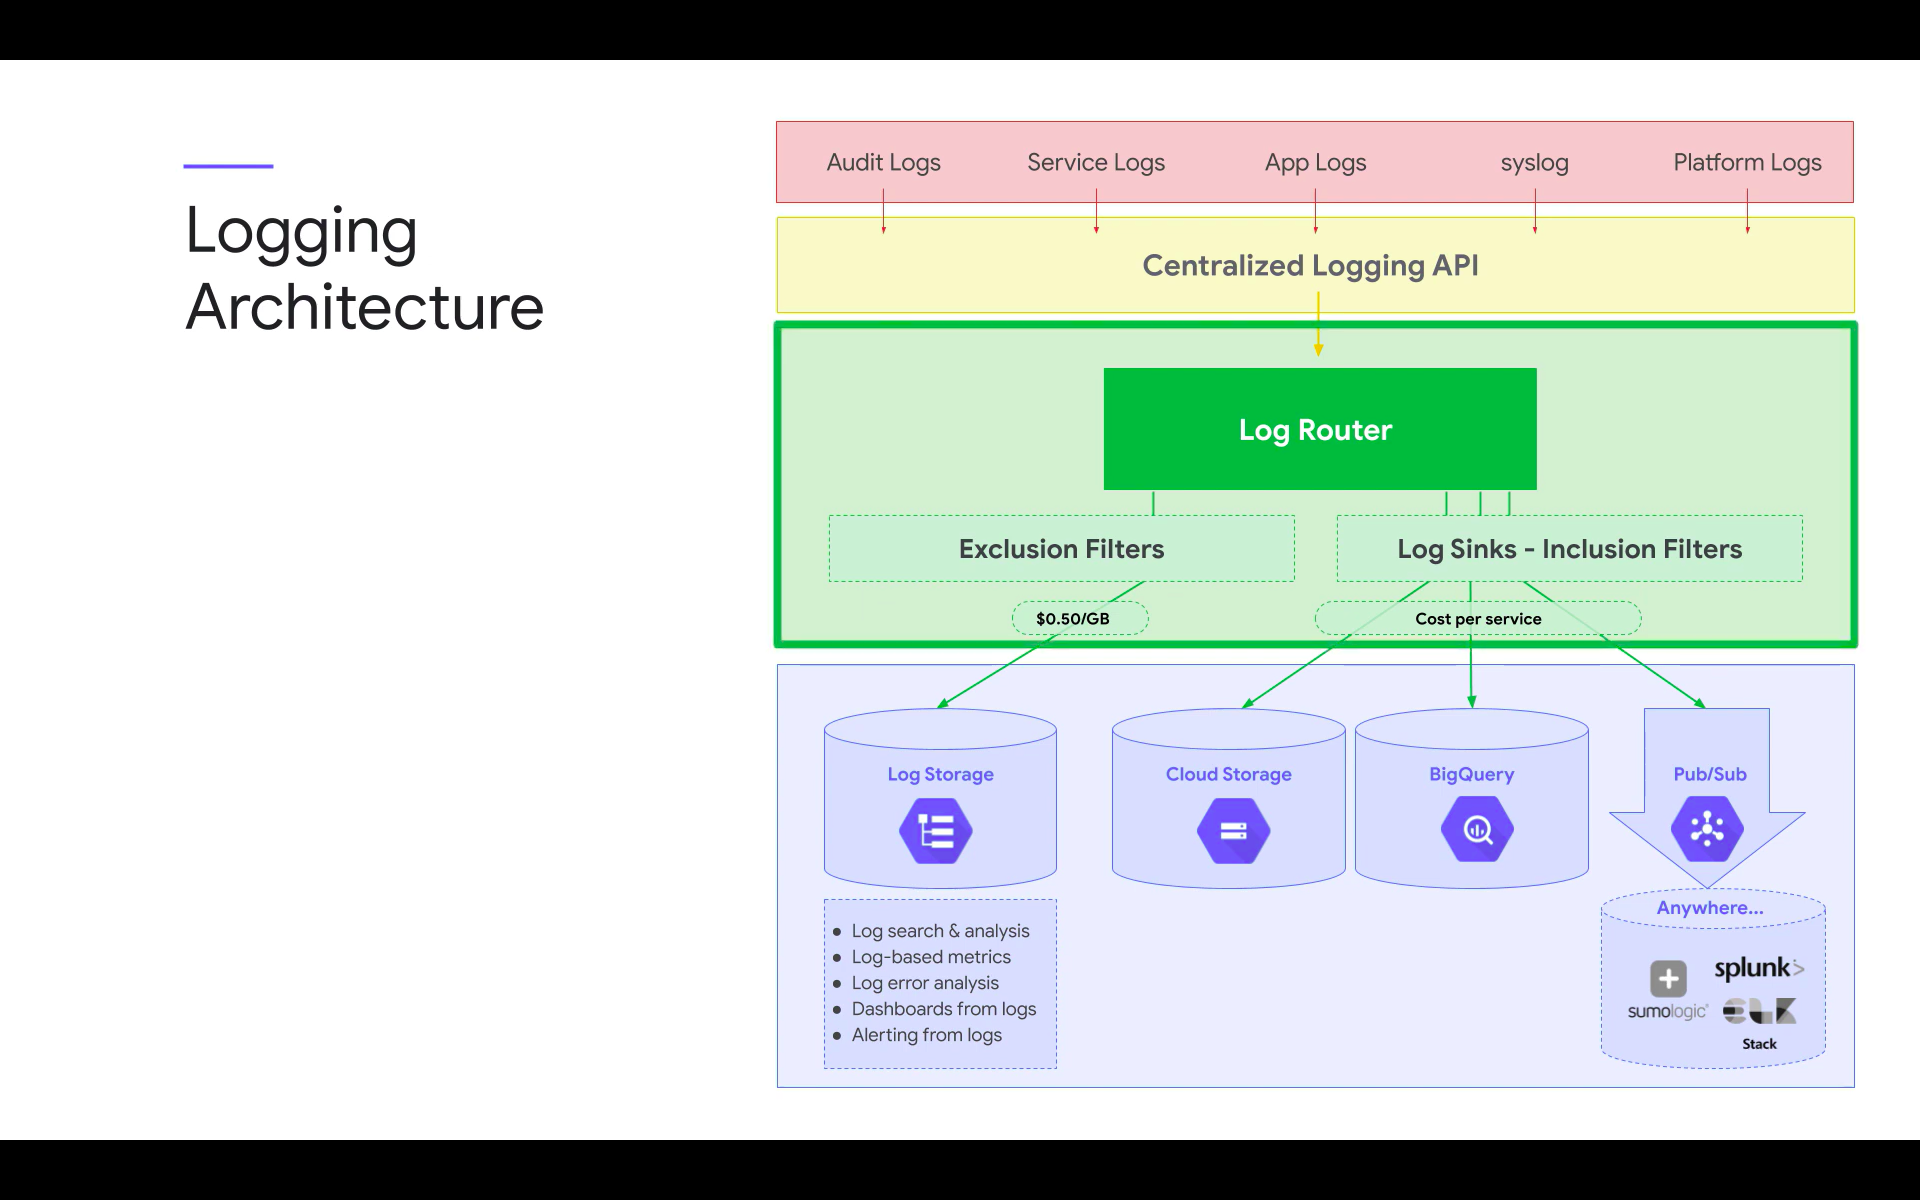
Ajouter un Dashboard pour un serveur Apache dans google cloud :
Installer l'agent sur le serveur :
:> agents_to_install.csv && \
echo '"projects/XXXXXXXXX/zones/europe-west1-b/instances/YYYYYYYYYY","[{""type"":""ops-agent""}]"' >> agents_to_install.csv && \
curl -sSO https://dl.google.com/cloudagents/mass-provision-google-cloud-ops-agents.py && \
python3 mass-provision-google-cloud-ops-agents.py --file agents_to_install.csvAssurez-vous d'avoir un agent de version 2.7 ou plus !
Vérifier que le serveur apache renvoie bien un statut :
curl localhost:80/server-status?autoServerVersion: Apache/XXXXX (Debian) OpenSSL/XXXXXX
ServerMPM: prefork
Server Built: 2022-06-20T19:03:00
CurrentTime: Saturday, 25-Feb-2023 01:06:32 UTC
RestartTime: Saturday, 25-Feb-2023 00:47:07 UTC
ParentServerConfigGeneration: 4
ParentServerMPMGeneration: 3
ServerUptimeSeconds: 1165
ServerUptime: 19 minutes 25 seconds
Load1: 0.04
Load5: 0.08
Load15: 0.18
Total Accesses: 119
Total kBytes: 1445
Total Duration: 96516
CPUUser: .66
CPUSystem: .29
CPUChildrenUser: 10.2
CPUChildrenSystem: 2.38
CPULoad: 1.16137
Uptime: 1165Configurer l'agent sur le serveur :
# Configures Ops Agent to collect telemetry from the app and restart Ops Agent.
set -e
# Create a back up of the existing file so existing configurations are not lost.
sudo cp /etc/google-cloud-ops-agent/config.yaml /etc/google-cloud-ops-agent/config.yaml.bak
# Configure the Ops Agent.
sudo tee /etc/google-cloud-ops-agent/config.yaml > /dev/null << EOF
metrics:
receivers:
apache:
type: apache
service:
pipelines:
apache:
receivers:
- apache
logging:
receivers:
apache_access:
type: apache_access
apache_error:
type: apache_error
service:
pipelines:
apache:
receivers:
- apache_access
- apache_error
EOF
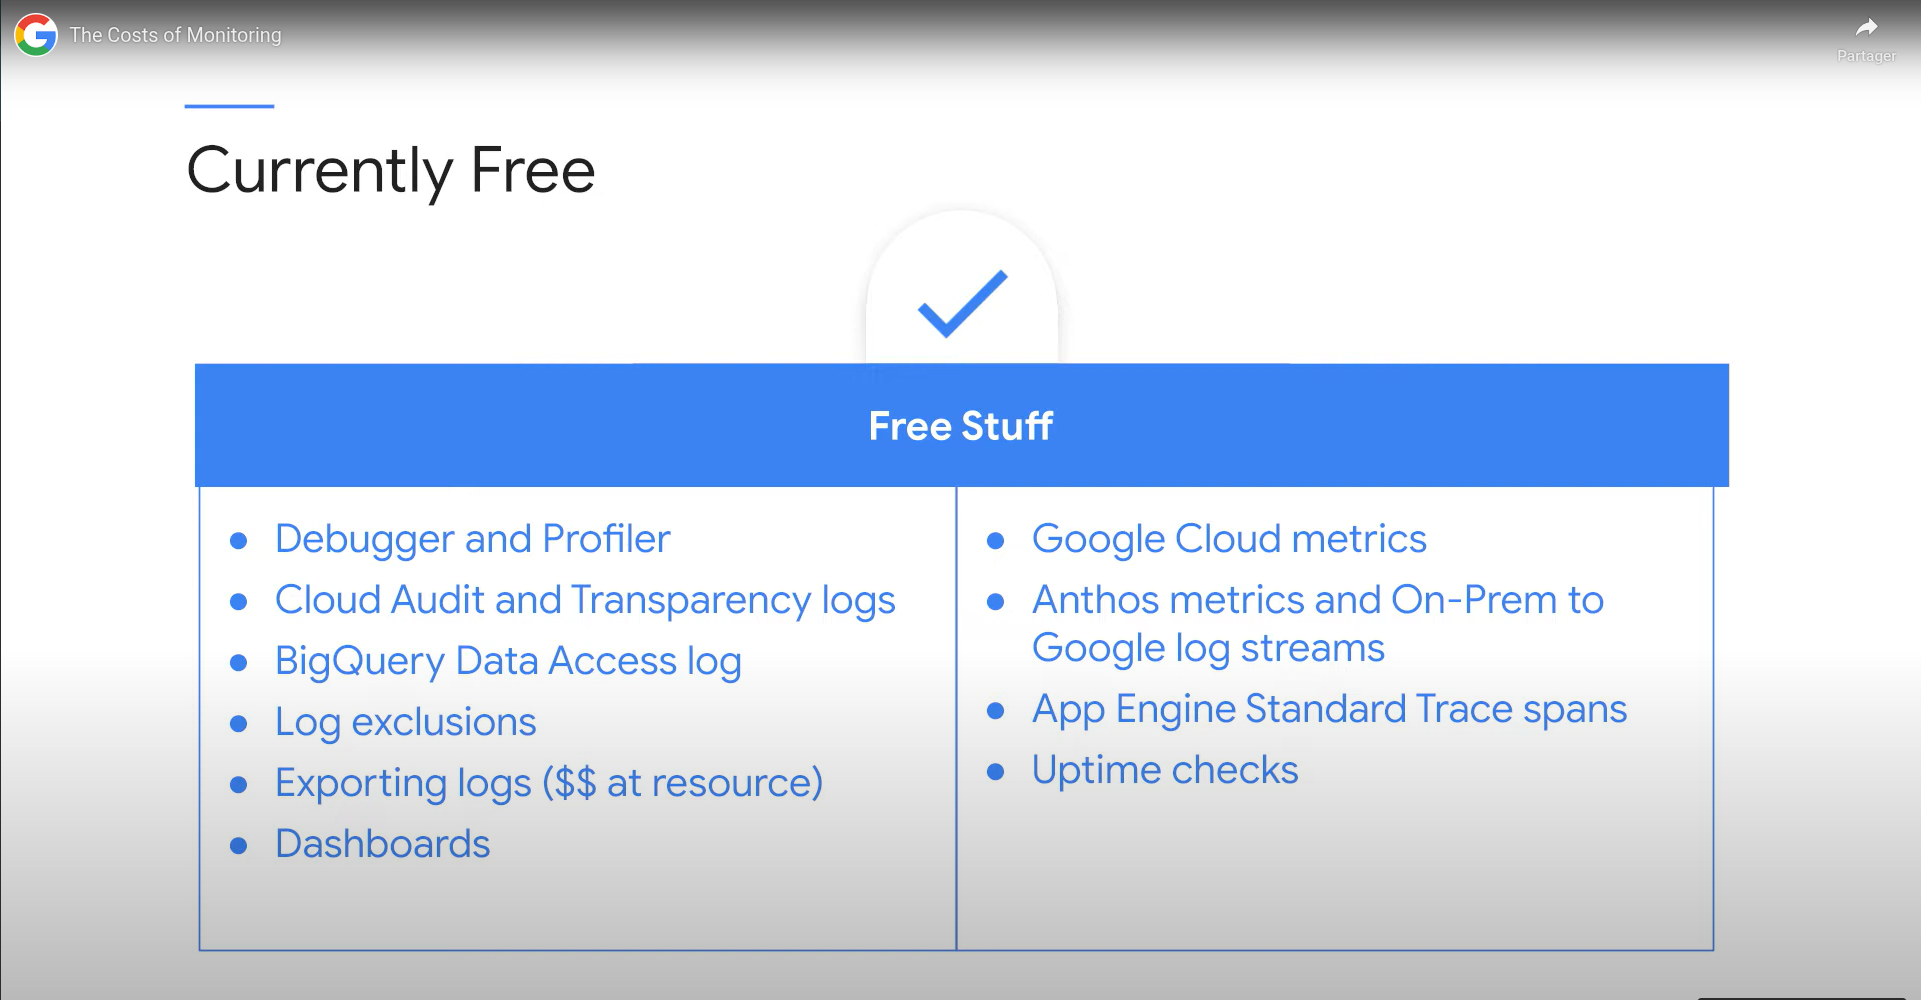
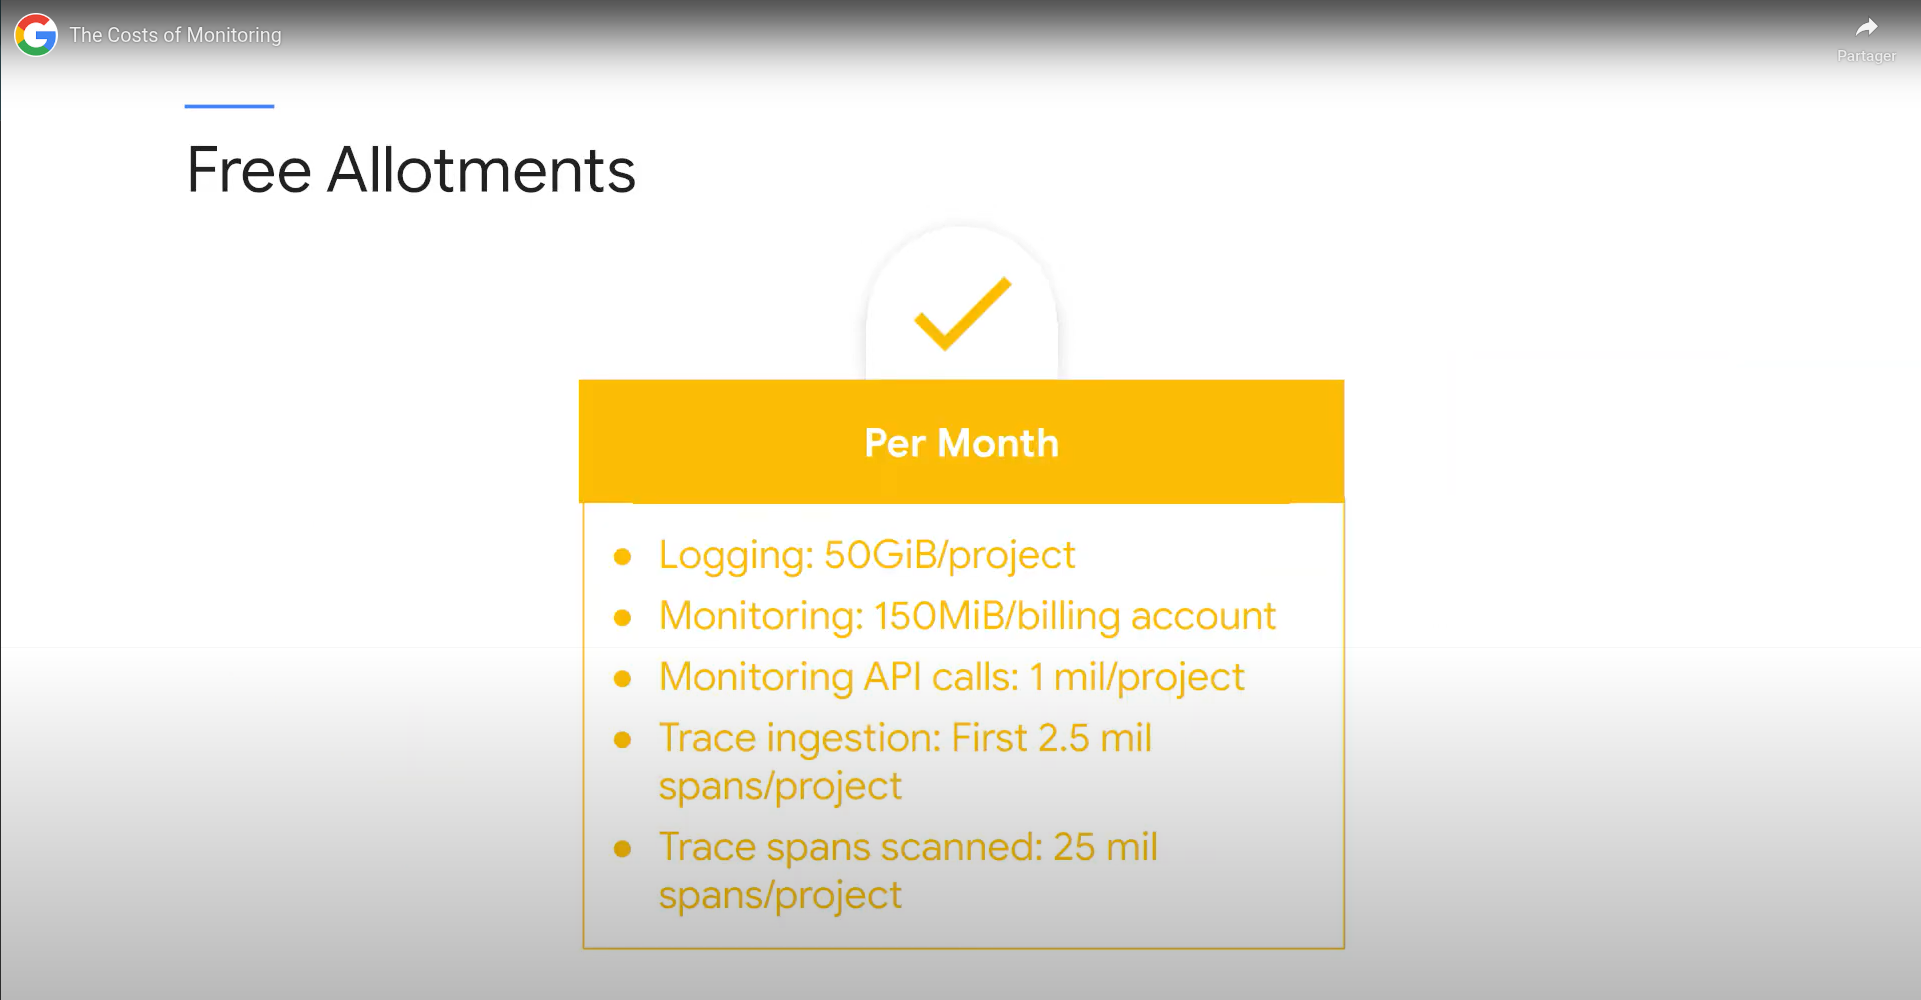
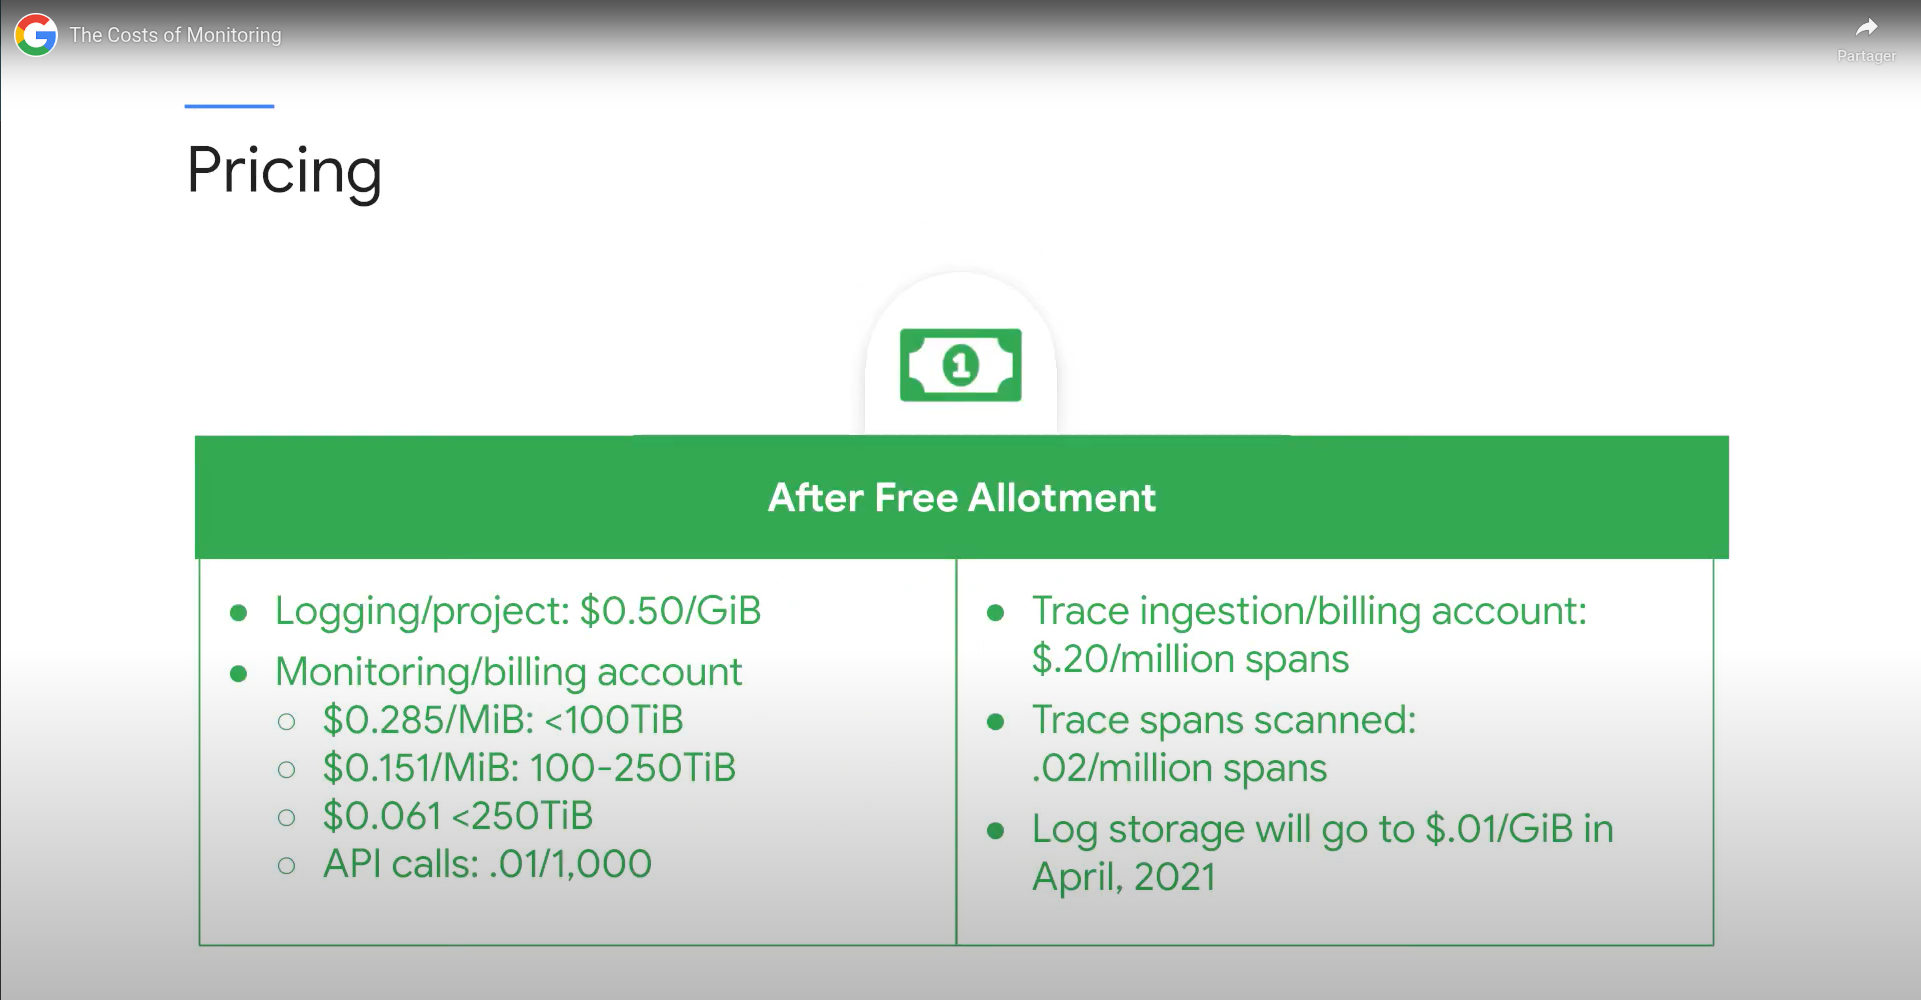
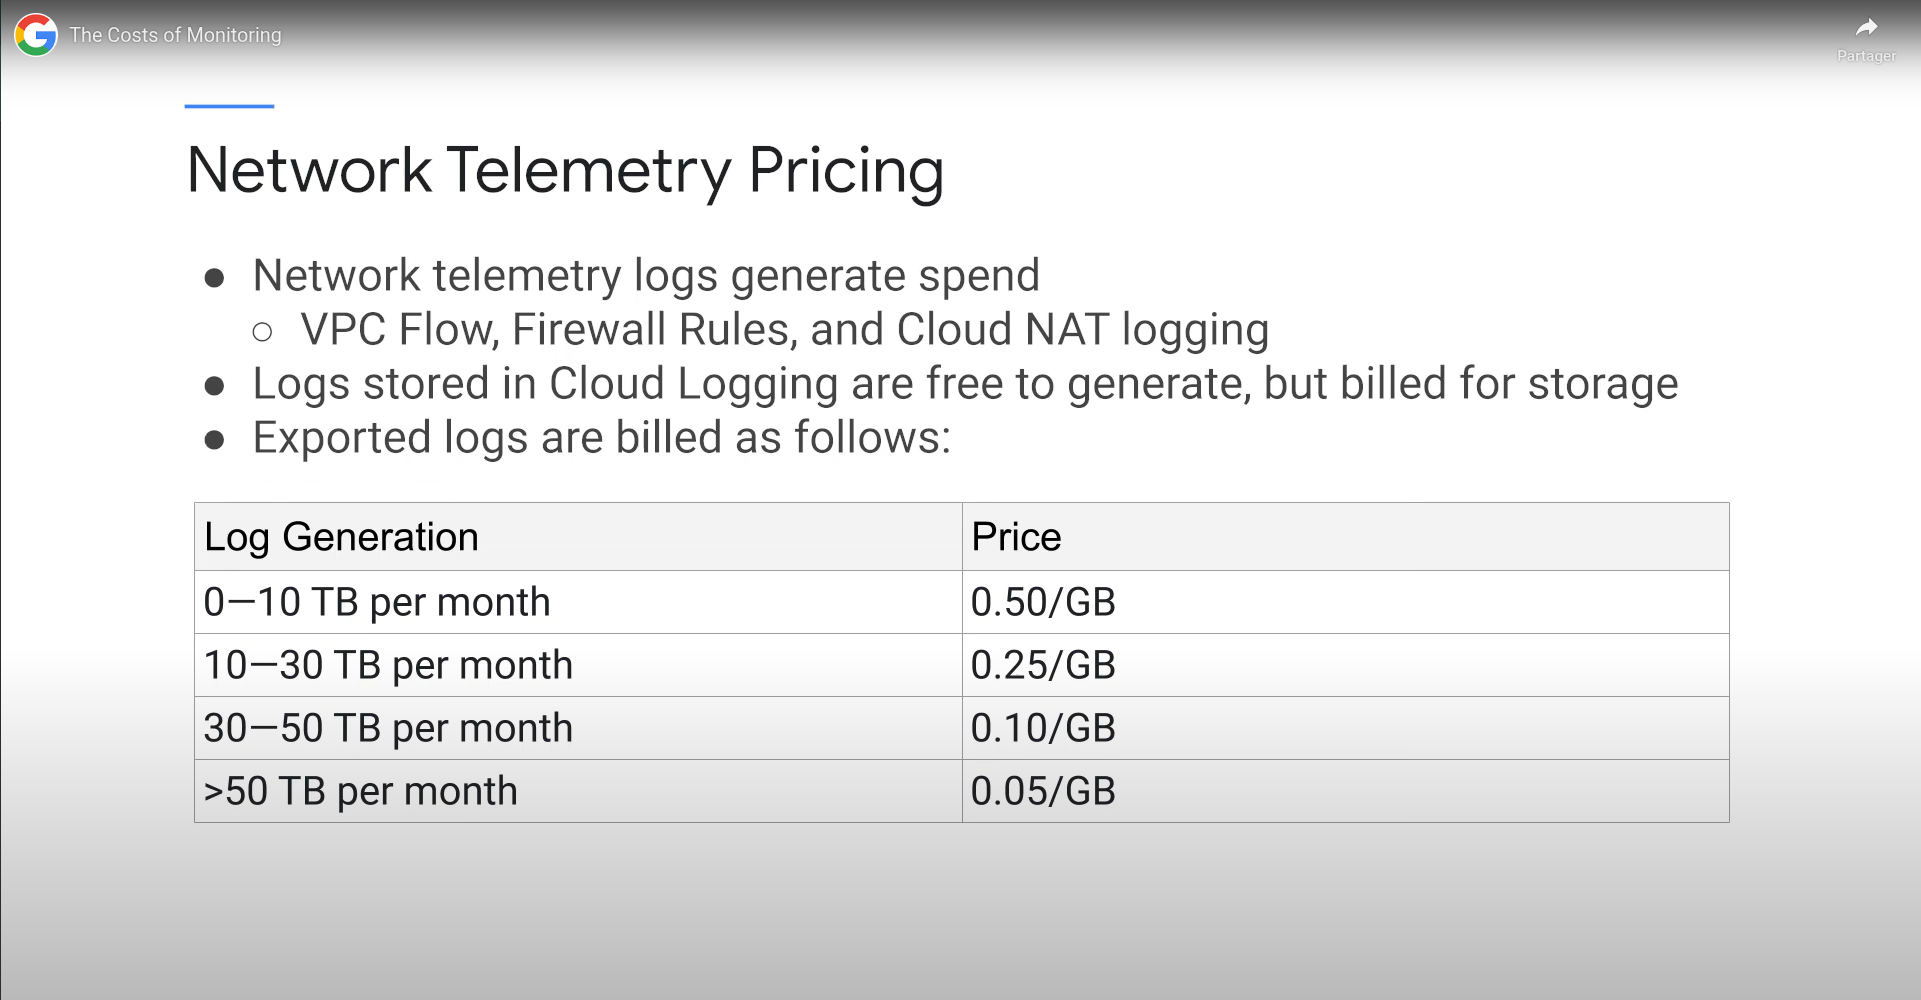
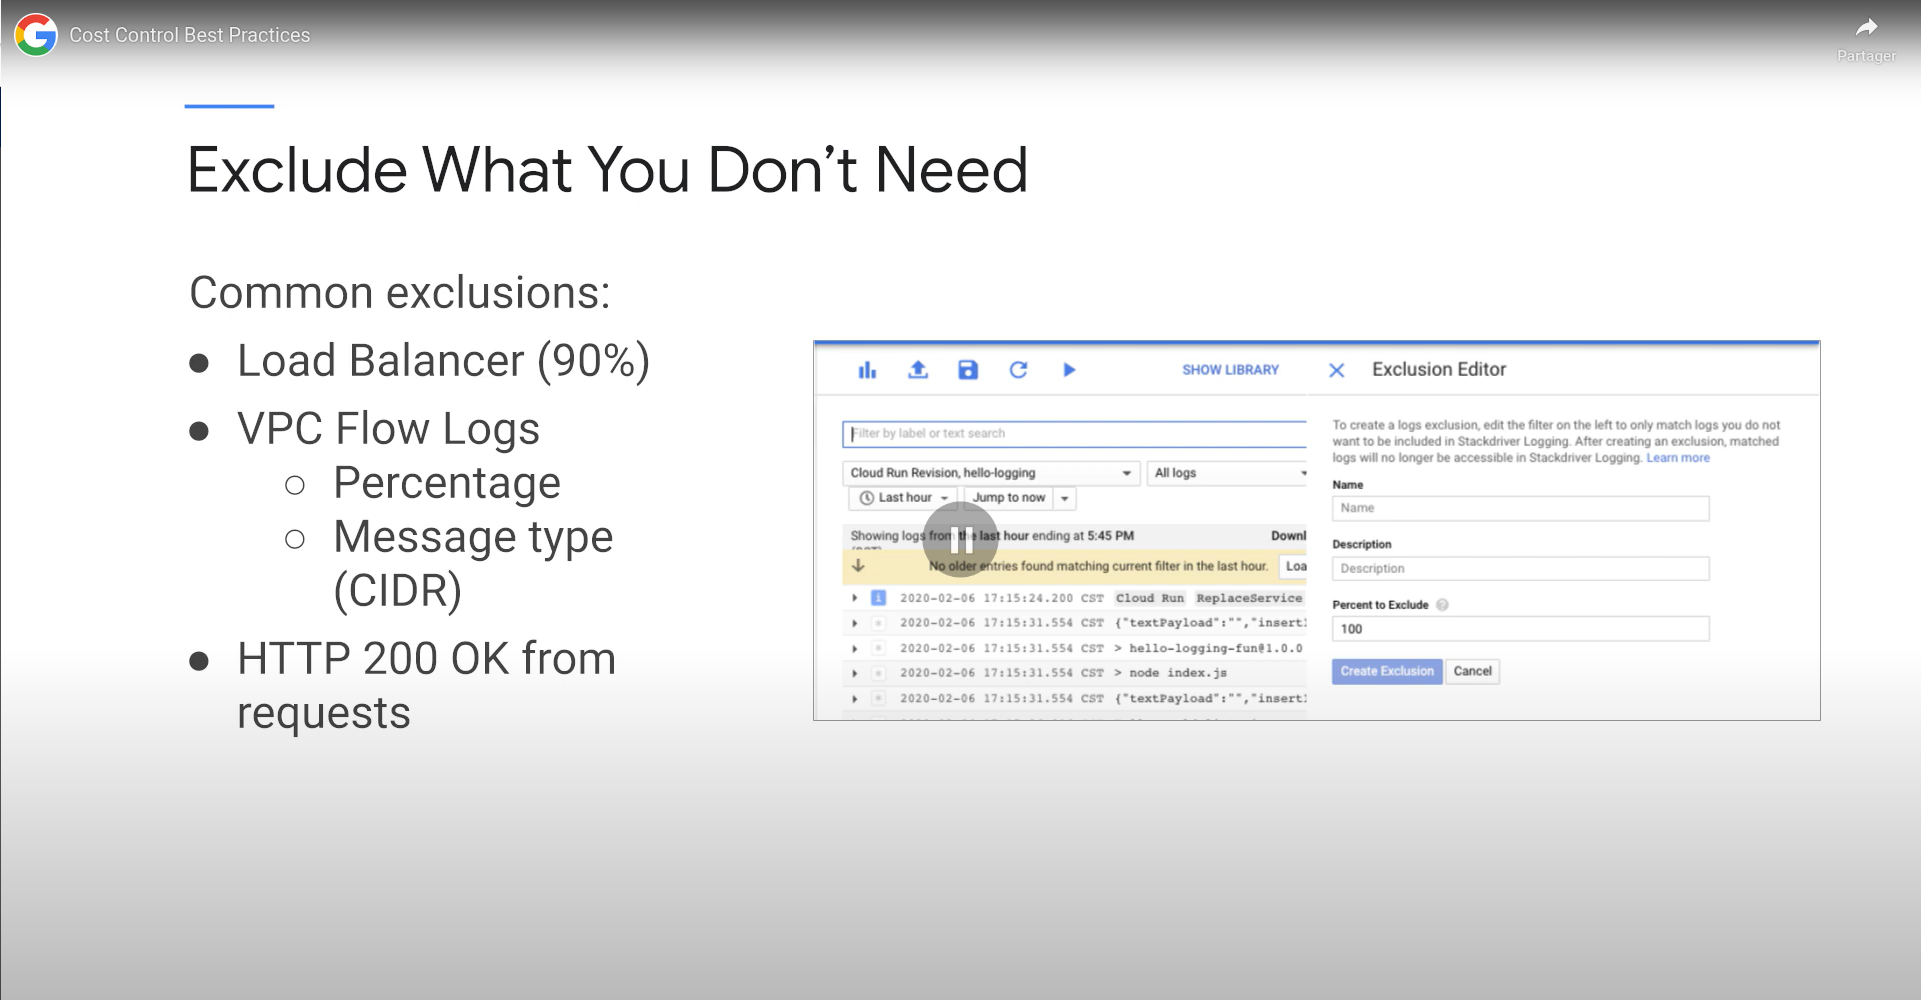
sudo service google-cloud-ops-agent restart[GOOGLE CLOUD] - gestion de la facturation des logs : https://youtu.be/crHSHI_m2Ng
Importer le Dashboard :
Se rendre sur https://console.cloud.google.com/monitoring/dashboards dans "Bibiliothéque d'exemples. Séléctionner Apache GCE Overview et cliquer sur importer :
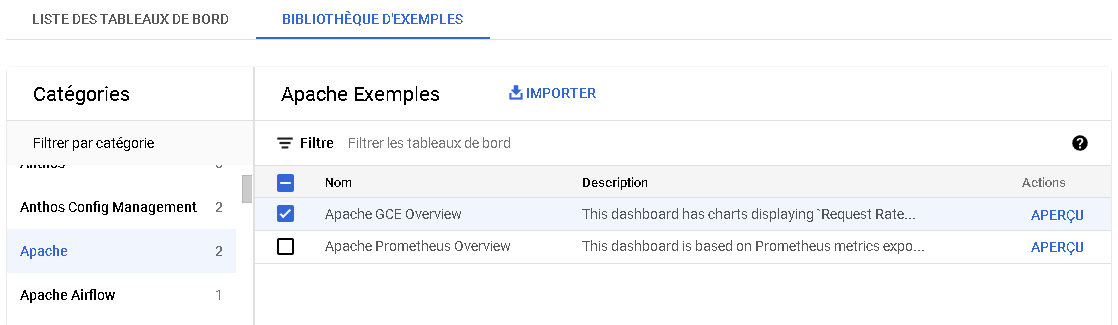
Puis confirmer l'import :

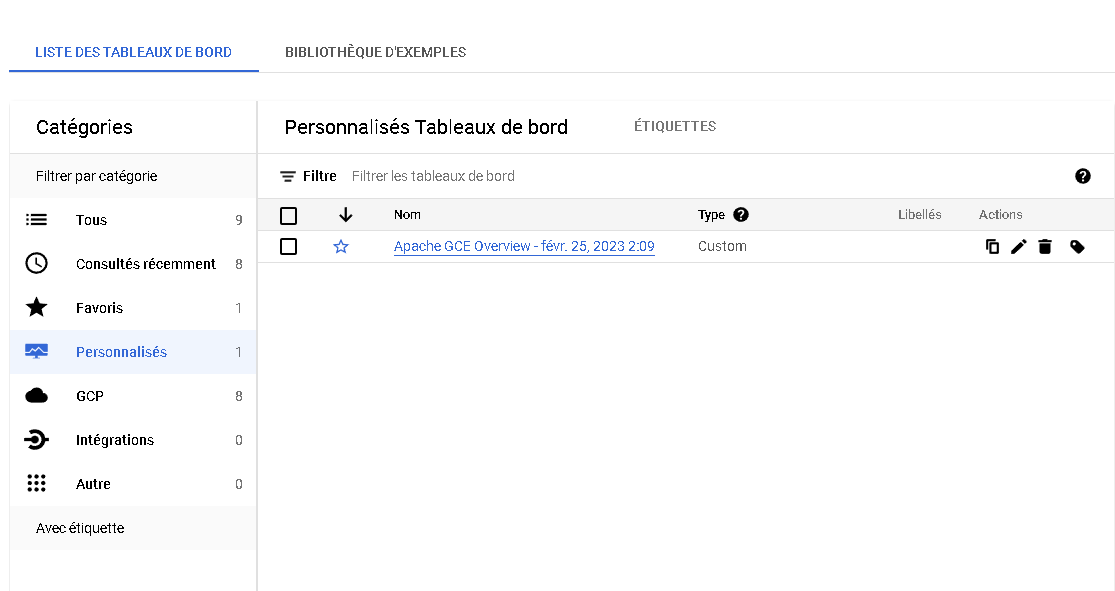
Le tableau de bord devrait s'afficher dans la liste des Dashs personalisés :
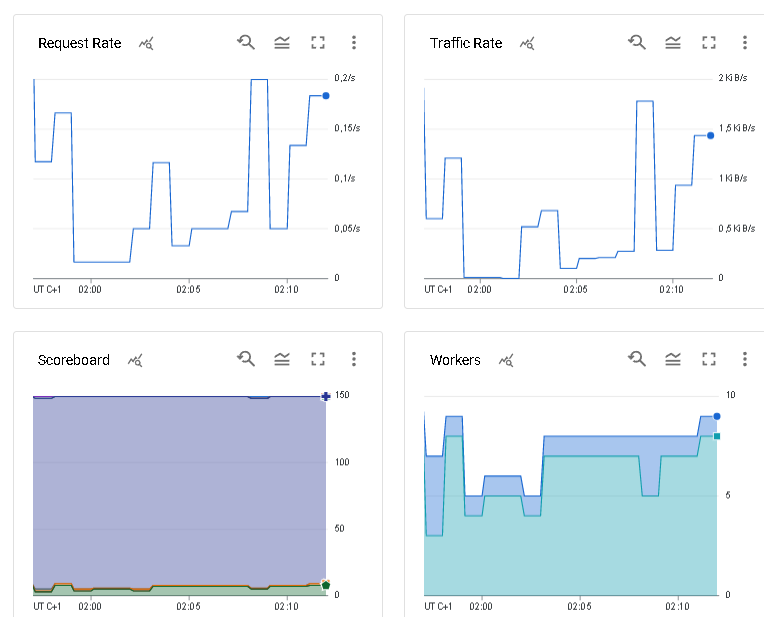
Voici un exemple de l'affichage du tableau :
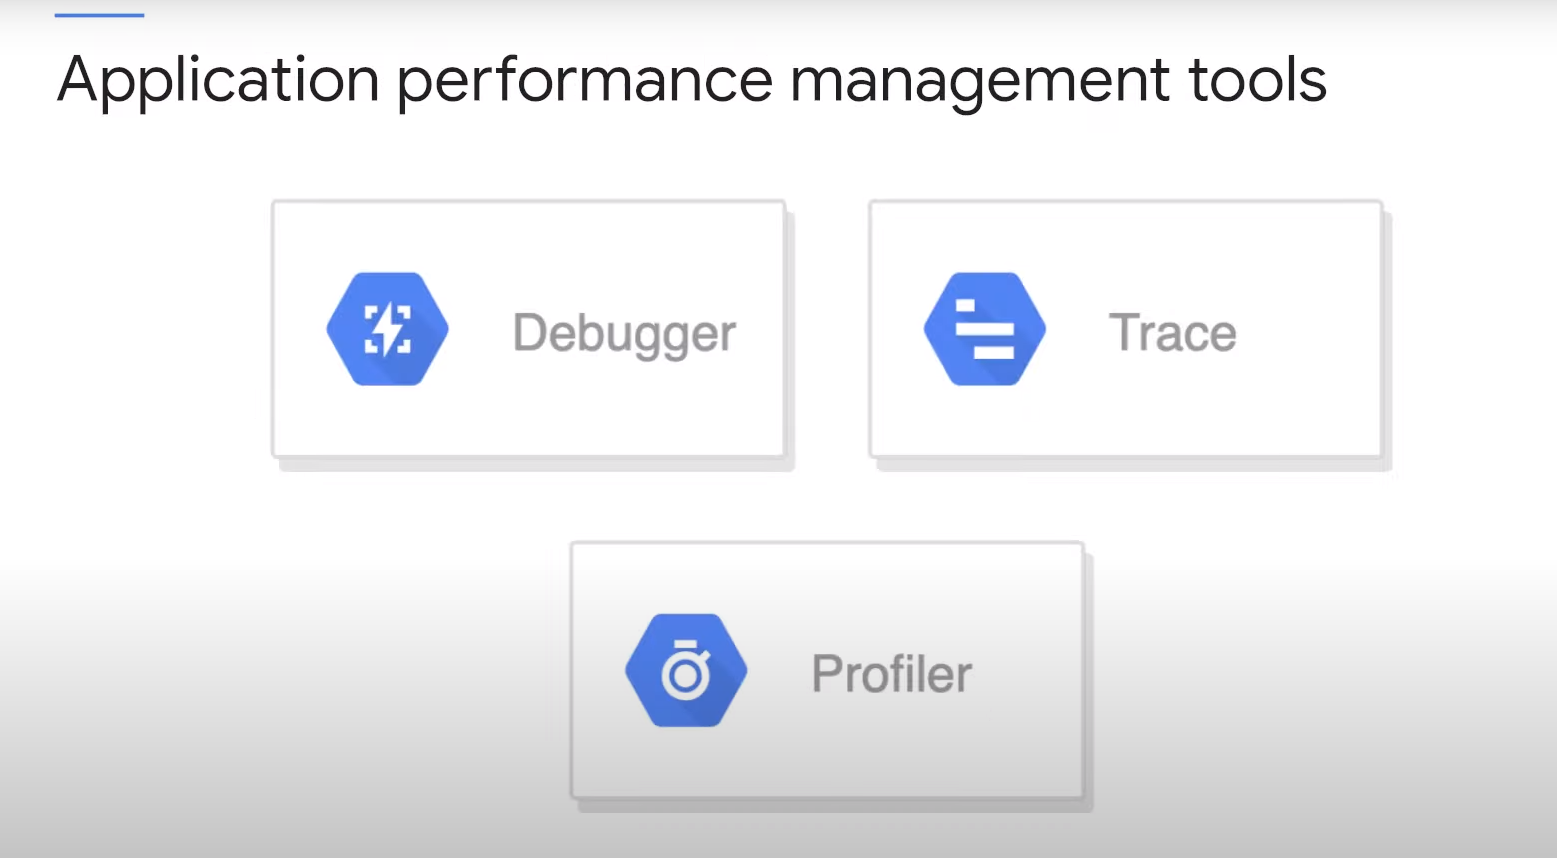
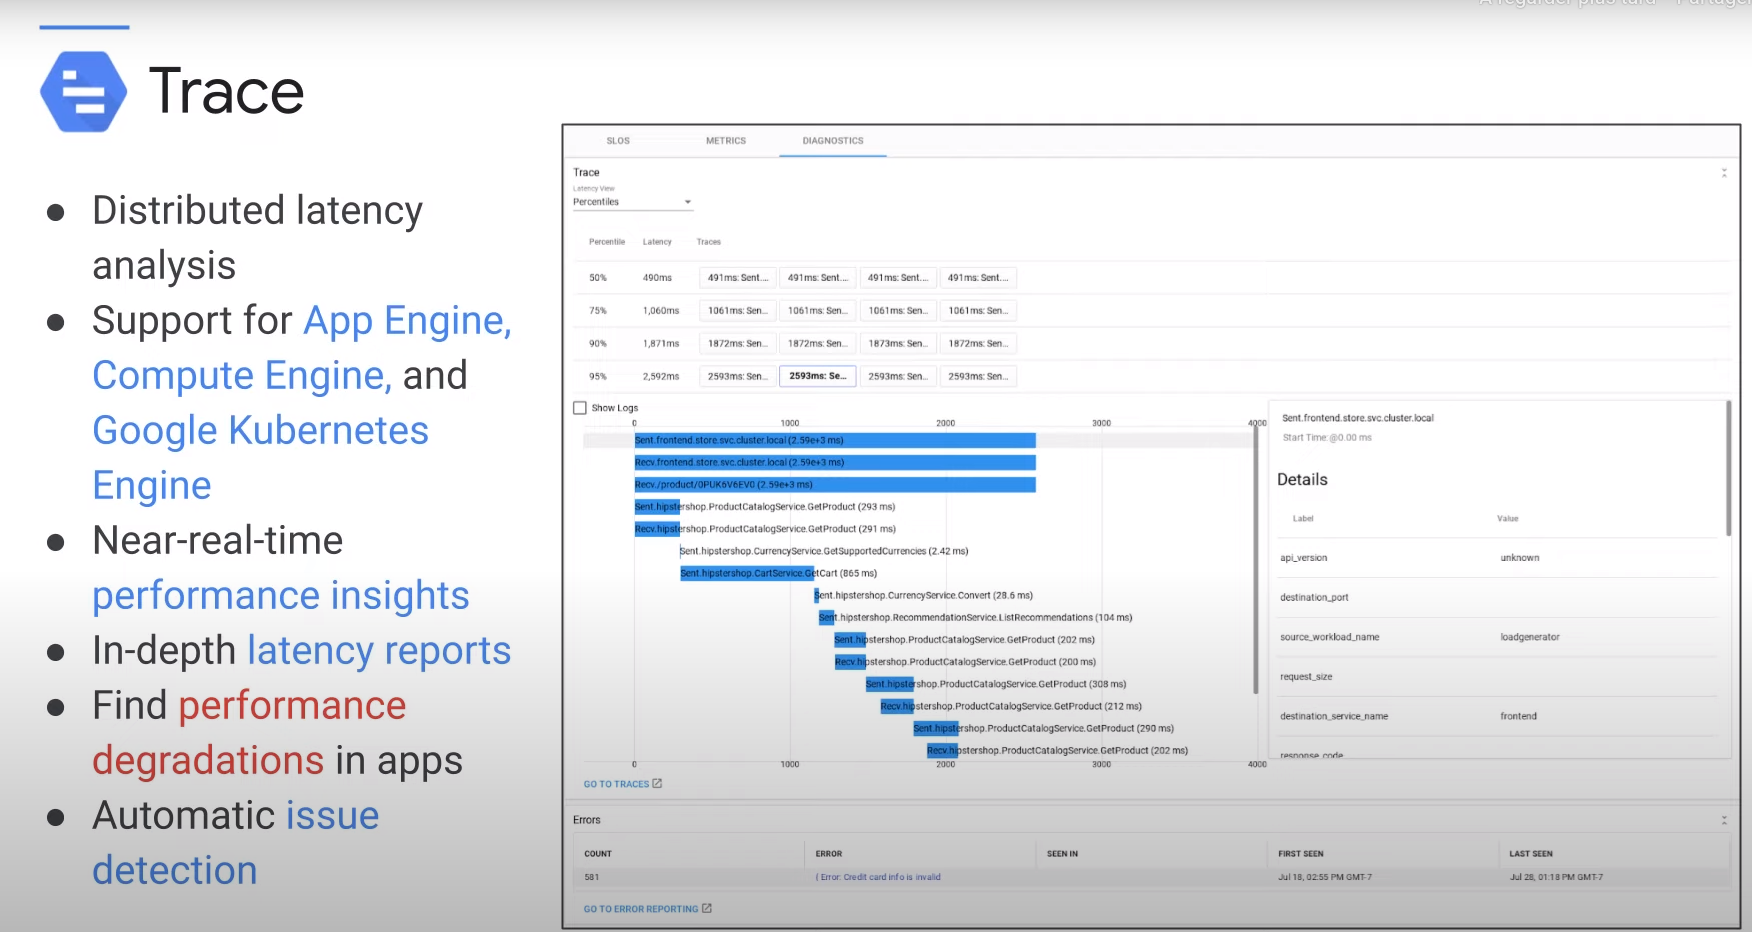
Trace
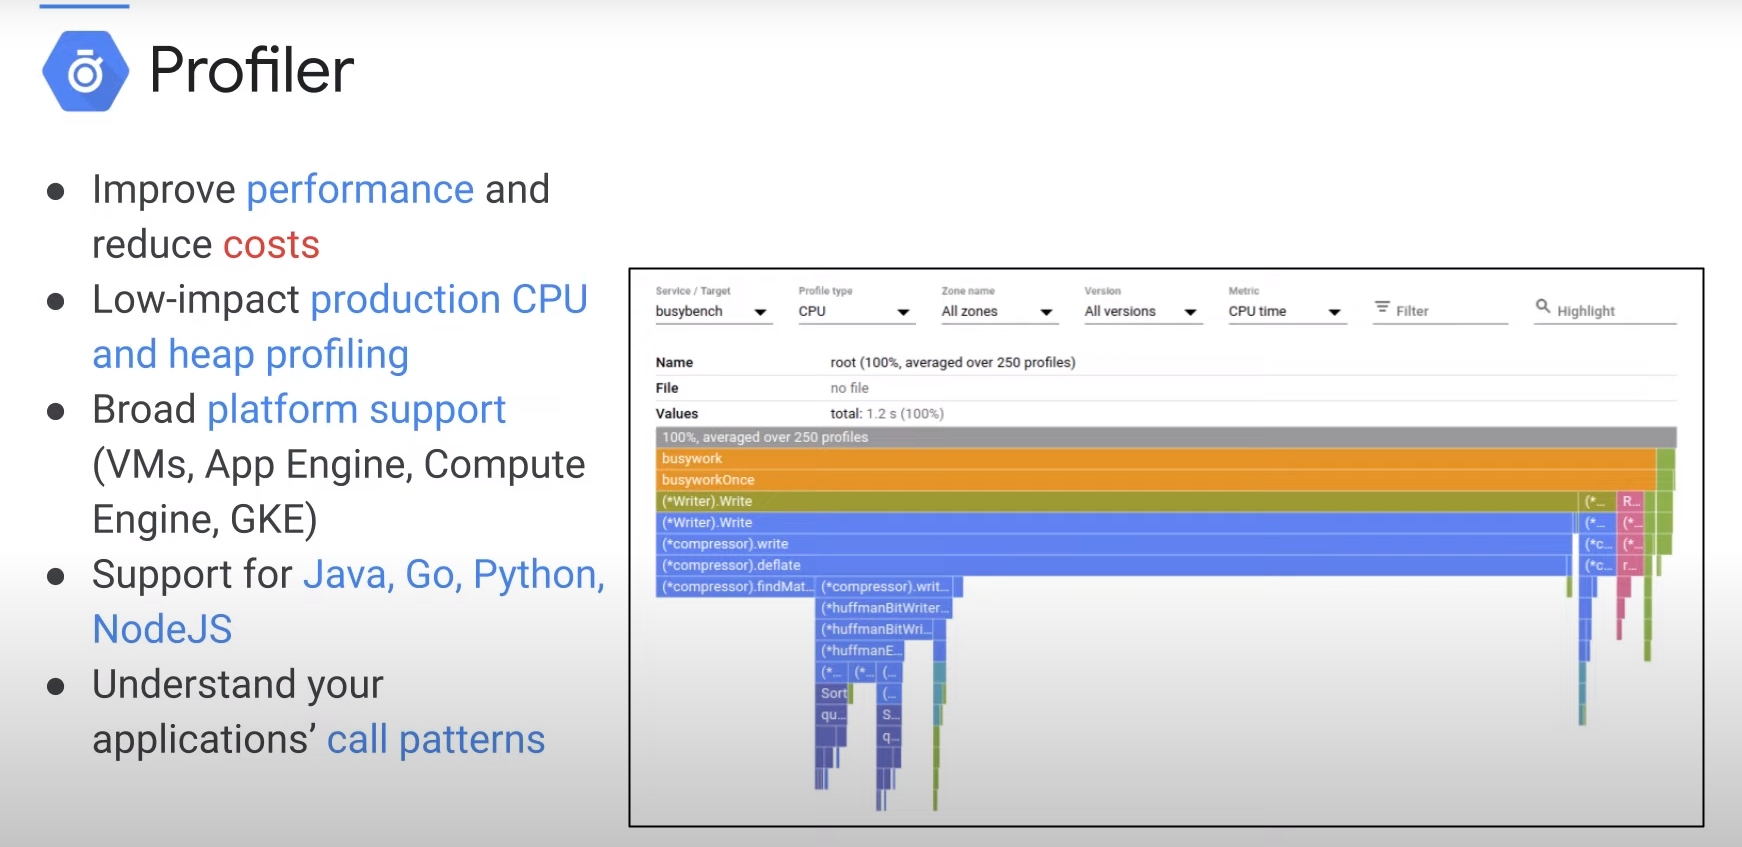
Profiler
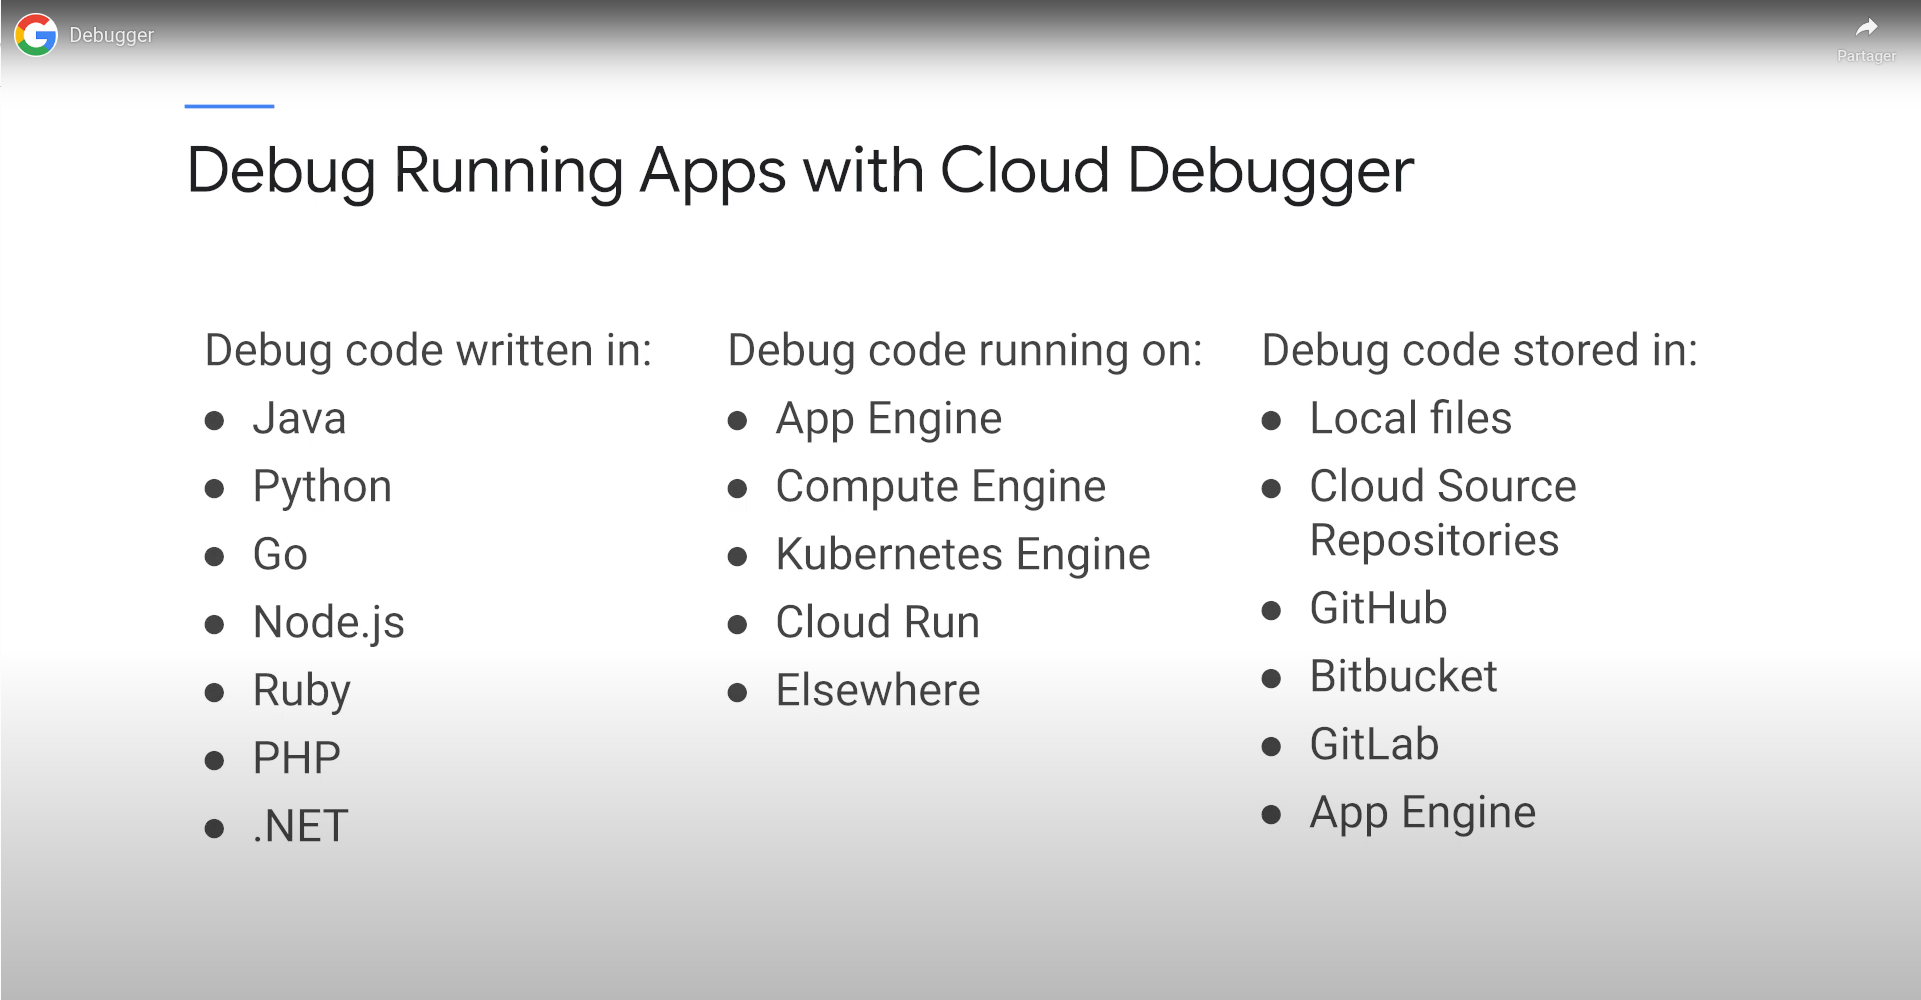
Debugger