Installer un serveur Prometheus et Grafana
Prometheus :
Installation des paquets nécessaires :
apt-get install prometheus curlRemplir le fichier /etc/prometheus/prometheus.yml comme ci-dessous :
scrape_configs:
  - job_name:       'node'
    scrape_interval: 5s
    static_configs:
      - targets: ['172.31.65.70:9090', '172.31.65.70:3000', '172.31.64.10:53', '172.31.64.30:53', '172.31.64.30:25', '172.31.65.10:80', '172.31.65.20:80', '172.31.65.50:21', '172.31.64.60:3306', '172.31.64.40:80']
        labels:
          group: 'production'

   - job_name:       'prometheus'
    scrape_interval: 5s
    static_configs:
      - targets: ['172.31.65.70:9090']
        labels:
          group: 'monitoring'

   - job_name:       'grafana'
    scrape_interval: 5s
    static_configs:
      - targets: ['172.31.65.70:3000']
        labels:
          group: 'monitoring'
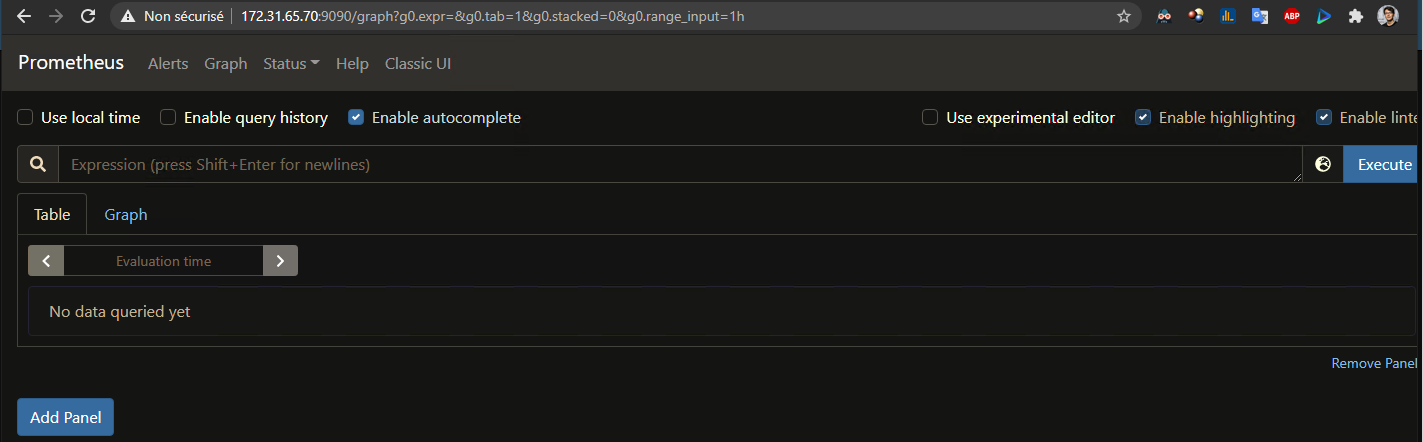
On se rend sur le site web http://172.31.65.70:9090/graph :
Garfana :
Installation des paquets nécessaires :
apt-get install gnupg gnupg2 gnupg1

apt-get install -y apt-transport-https
apt-get install -y software-properties-common wget
wget -q -O - https://packages.grafana.com/gpg.key | apt-key add -

echo "deb https://packages.grafana.com/oss/deb stable main" | tee -a /etc/apt/sources.list.d/grafana.list

sudo apt-get update
sudo apt-get install grafana

service grafana-server start
Fichier de configuration /etc/grafana/grafana.ini
On se rend sur le site web http://172.31.65.70:3000 :
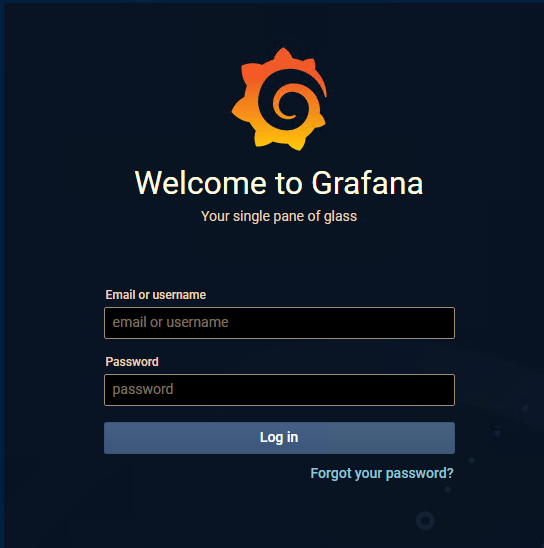
Identifiants et mot de passe par défaut : admin
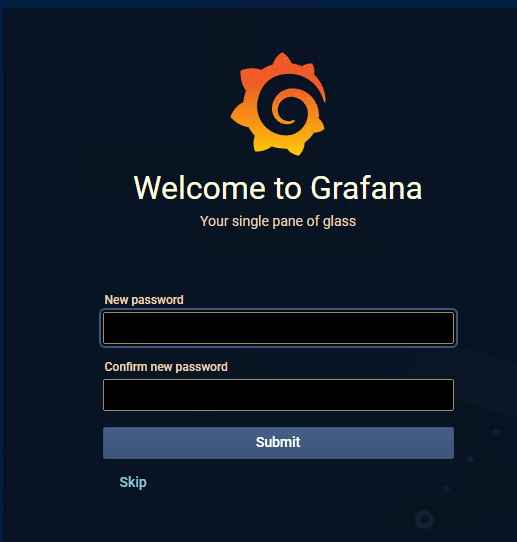
Vous pouvez choisir de conserver ou de modifier le mot de passe admin :
Puis, on ajoute une source de données :
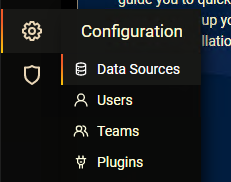
On nous proposer d'ajouter Prometheus comme source de données :

On entre les informations ci-dessous puis on sauvegarde :

Puis installer un serveur node_exporter :
nano /etc/prometheus/prometheus.ymlscrape_configs:
- job_name: 'prometheus'
scrape_interval: 5s
scrape_timeout: 5s
static_configs:
- targets: ['localhost:9090']
- job_name: 'node-exporter'
static_configs:
- targets: ['172.31.65.70:9100']
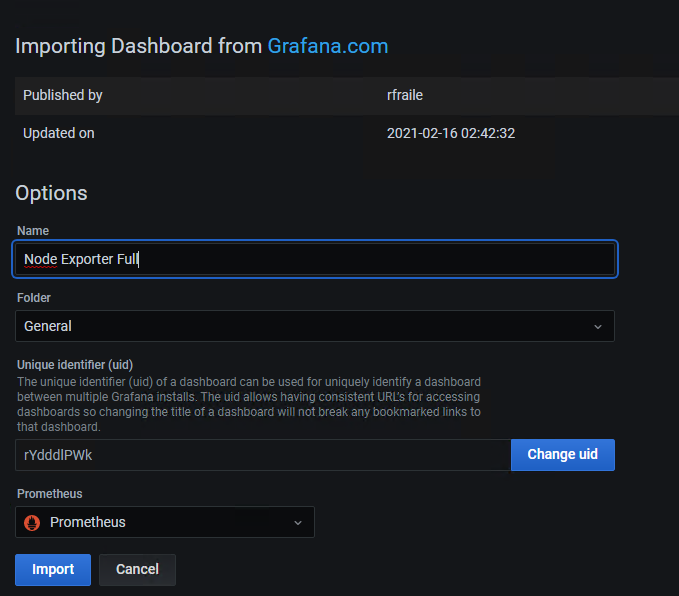
Puis, on se rend sur Grafana et on import un dashboard :

Puis on précise les informations comme ci-dessous :